DATA SCIENCE · SAN DIEGO

I build the decision tools behind churn, pricing, and risk.

A decade of analytics across finance and energy. I ship machine-learning pipelines a reviewer can clone and run — and Tableau dashboards that drill from the headline number to the customers behind it. Open to data scientist and senior data analyst roles.

Python · SQL · Tableau · scikit-learn · XGBoost · PySpark · Docker · MLflow

Why you can trust my numbers

1.000 single-feature "AUC" target leakage — too good to be true
0.505 honest out-of-fold baseline a coin flip, measured properly
0.758 rebuilt, leakage-safe the number that ships

Featured work

Two projects, each with a working artifact. Every number below comes from the committed pipeline outputs — verifiable one click away.

Customer churn analytics

Flagshipsynthetic demo data

Which customers are about to leave, and what revenue is at stake?

An end-to-end churn pipeline built the honest way: a leakage screen caught a variable that alone predicted churn perfectly, so the model was rebuilt and every customer scored out of fold. The export feeds a live Tableau dashboard with risk tiers and revenue at risk.

0.758out-of-fold ROC-AUC $95,704modeled monthly revenue at risk 2,000customers scored per run

Modeled on a seeded synthetic sample of 2,000 customers — built so anyone can reproduce the pipeline; full disclosure in the case study.
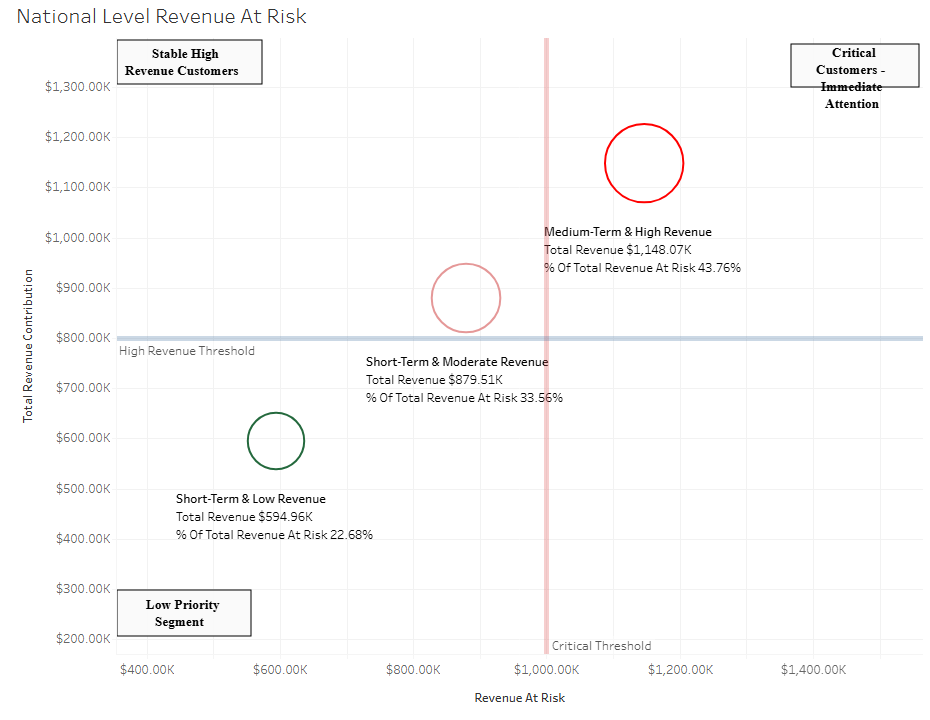
National level revenue-at-risk quadrant chart from the churn Tableau dashboard, grouping customer segments by revenue and risk Live Tableau Public dashboard, captured 2026-07-08
Bulldozer price regression

Featured

What will heavy equipment sell for at auction?

Auction price prediction on 412,698 Kaggle Blue Book bulldozer records. Date-based feature engineering, a time-aware validation split, and a tuned XGBoost model tracked with MLflow. The strongest pricing signal turned out to be listing completeness — a finding that changes how a business collects data.

$10,480validation MAE 0.398validation RMSLE 412,698auction records
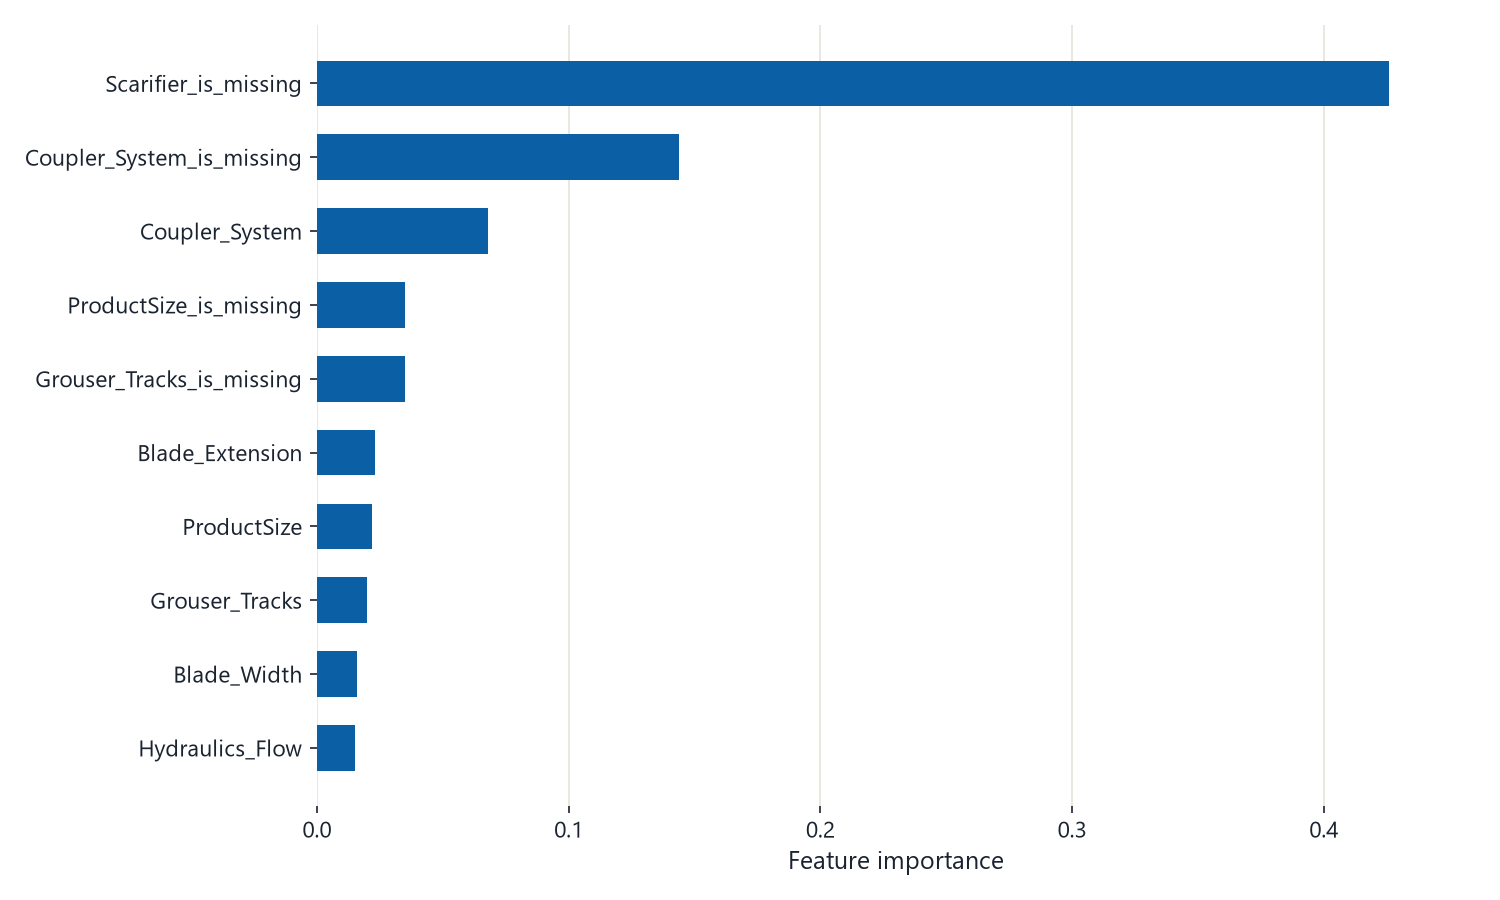
Bar chart of the tuned XGBoost model's top ten features, led by Scarifier-is-missing at 0.43 importance Top model features — missingness fields carry real pricing signal

Live dashboards

Both run on Tableau Public — click through and explore the real thing.

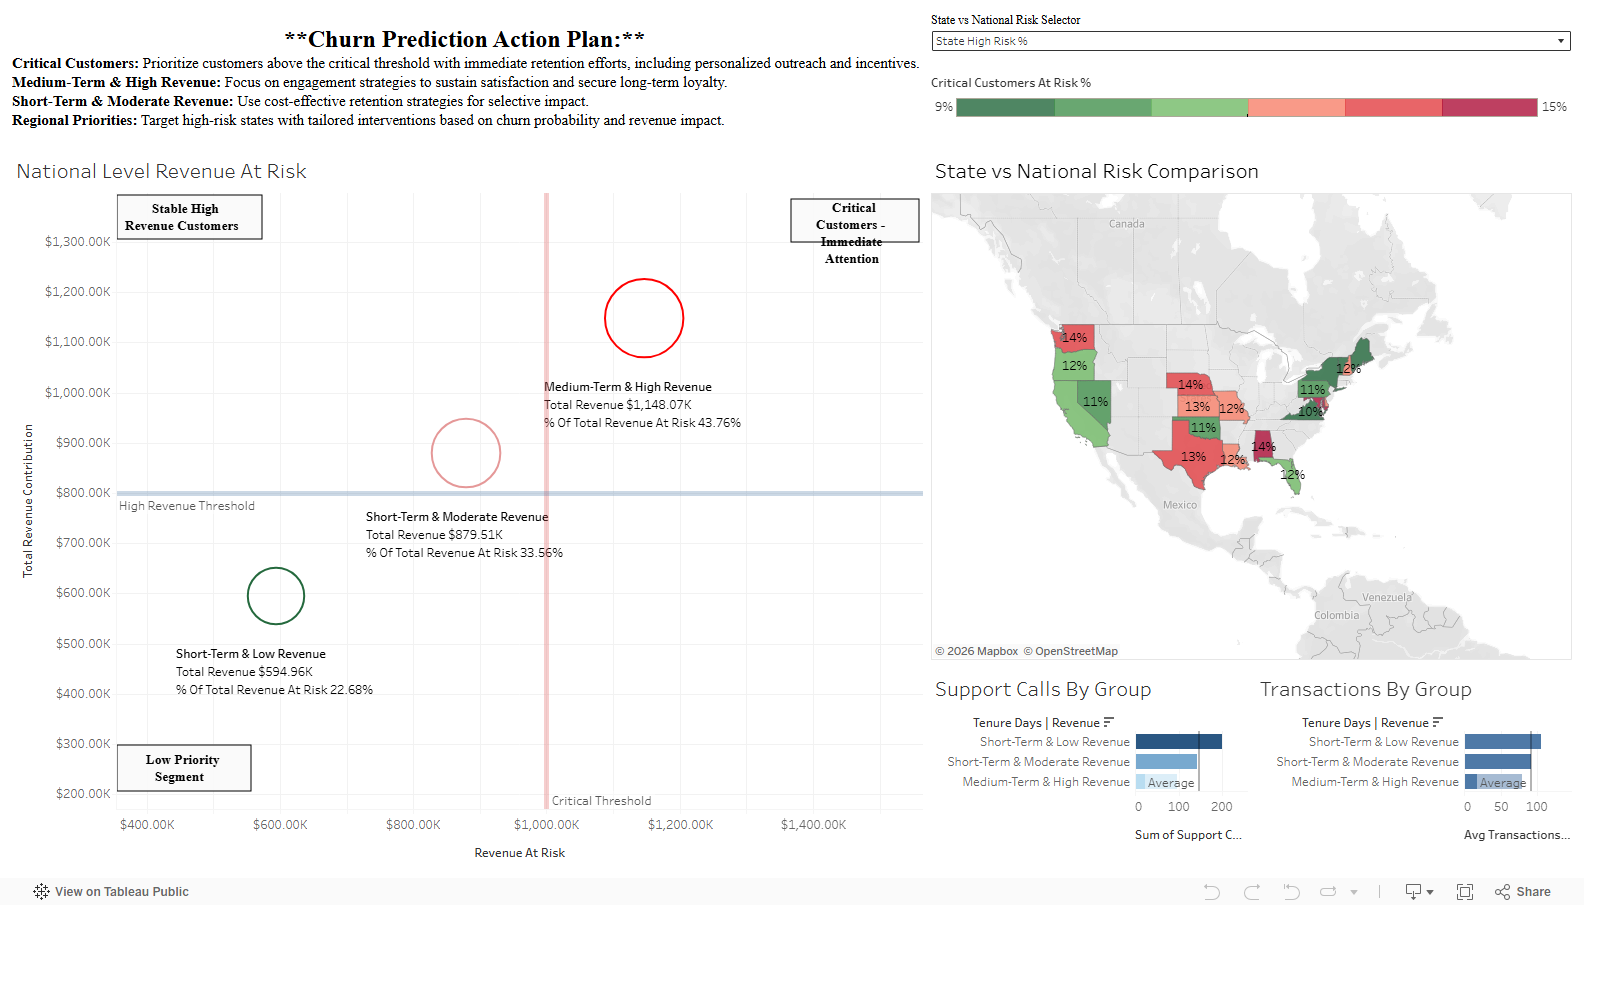
Churn prediction dashboard with national revenue-at-risk chart and state risk map

Churn prediction — risk and revenue

Revenue at risk by segment, state-level risk comparison, and support-call patterns by risk group, fed directly by the churn pipeline's export.

View full dashboard →
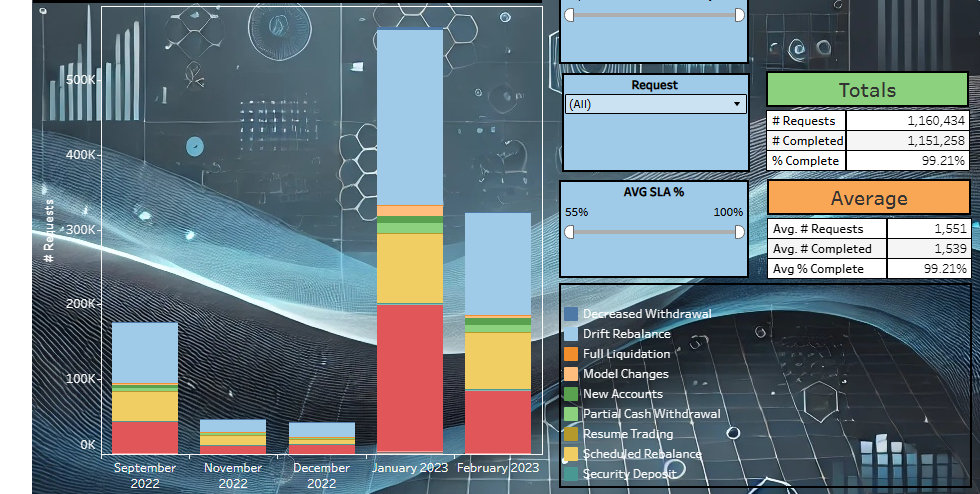
Operations team KPI totals and stacked monthly request-volume bar chart

Operations team KPIs

1.16M requests tracked at a 99.2% completion rate across a six-month window (Sep 2022 – Feb 2023), with request-type breakdowns and SLA filtering.

View full dashboard →

How I work

Three habits that show up in every project above.

Honest models over pretty numbers

The churn project's headline is a 0.758 AUC because the perfect-looking score was leakage, and the writeups say so. Limitations are documented, not hidden.

Reproducible by strangers

Pinned dependencies, sample data that ships, Docker entrypoints, MLflow tracking. If it cannot be rerun from a fresh clone, it is not done.

Built for the decision

Every model ends in something a stakeholder can use: risk tiers, revenue at risk, and drilldowns from the aggregate to the exact customers to call.

Experience

Ten years across consulting, escrow, wealth management, and clean energy, now paired with graduate data science coursework.

May 2025 – Sep 2025
Data analyst · Doc2Doc

Built Python and SQL validation workflows in Snowflake for credit-risk model training data, auditing 200+ CRM fields and identifying data gaps. Developed derived risk features including weighted-average FICO and three-month rolling prepayment averages, reducing reporting errors by approximately 15% and saving 10 hours of manual work per month.

May 2023 – Sep 2024
Data analyst · Ivy Energy

Built energy forecasting models and Python automation for large-scale data integration; automated manual billing workflows with SQL and Python, saving $12,000 a year and earning the top performance rating.

Apr 2020 – Apr 2023
Business intelligence analyst · LPL Financial

Financial modeling and Tableau KPI dashboards for an $8B portfolio; market segmentation and variance analysis that shaped allocation strategy and cut weekly analysis time.

Feb 2017 – Jan 2019
Data analyst · Franklin Escrow

Regression analysis on transaction data that removed inefficiencies worth $80,000 a year; KPI dashboards, demand forecasting, and A/B testing for targeted campaigns.

Aug 2014 – Feb 2017
Business intelligence analyst · Deloitte

Excel and SQL KPI dashboards with real-time tracking across client projects; led a customer feedback analysis that used predictive insights to lift retention and reduce churn.

Toolkit

Grouped the way the work actually flows.

CollectSQL · APIs · Excel VBA
ProcessPython · pandas · PySpark · Docker
Modelscikit-learn · XGBoost · MLflow
CommunicateTableau · dashboards · case studies